Strategy Tester Report
LSMA_Daily_EA[1]
AlpariUK-Demo (Build 225)
| Symbol | EURUSD (Euro vs US Dollar) | ||||
| Period | 1 Hour (H1) 2009.08.03 01:00 - 2009.10.01 00:00 (2009.08.01 - 2009.10.01) | ||||
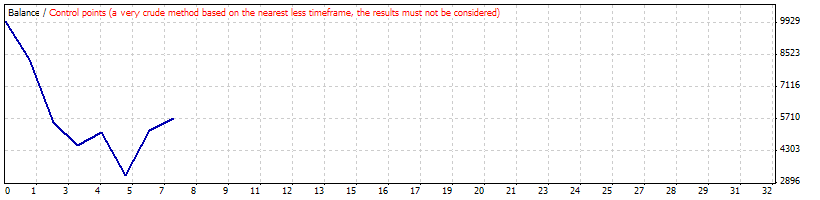
| Model | Control points (a very crude method, the results must not be considered) | ||||
| Parameters | Expert_Name=""LSMA_Daily""; LSMAShortPeriod=7; LSMALongPeriod=16; mm=""---Money"; Lots=1; MaxLots=100; UseMoneyManagement=false; BrokerIsIBFX=false; m1="Set mini and micro to false for standard account"; AccountIsMini=false; AccountIsMicro=false; fm="UseFreeMargin = false to use Account Balance"; UseFreeMargin=false; TradeSizePercent=10; BrokerPermitsFractionalLots=false; st6=""--Profit"; StopLoss=0; TakeProfit=0; Slippage=3; | ||||
| Bars in test | 1124 | Ticks modelled | 25909 | Modelling quality | n/a |
| Mismatched charts errors | 3 | ||||
| Initial deposit | 10000.00 | ||||
| Total net profit | -4247.40 | Gross profit | 3110.90 | Gross loss | -7358.30 |
| Profit factor | 0.42 | Expected payoff | -606.77 | ||
| Absolute drawdown | 7173.40 | Maximal drawdown | 7608.40 (72.91%) | Relative drawdown | 72.91% (7608.40) |
| Total trades | 7 | Short positions (won %) | 4 (25.00%) | Long positions (won %) | 3 (66.67%) |
| Profit trades (% of total) | 3 (42.86%) | Loss trades (% of total) | 4 (57.14%) | ||
| Largest | profit trade | 1975.00 | loss trade | -2749.50 | |
| Average | profit trade | 1036.97 | loss trade | -1839.57 | |
| Maximum | consecutive wins (profit in money) | 2 (2517.90) | consecutive losses (loss in money) | 3 (-5458.20) | |
| Maximal | consecutive profit (count of wins) | 2517.90 (2) | consecutive loss (count of losses) | -5458.20 (3) | |
| Average | consecutive wins | 2 | consecutive losses | 2 | |
| # | Time | Type | Order | Size | Price | S / L | T / P | Profit | Balance |
| 1 | 2009.08.03 01:00 | sell | 1 | 1.00 | 1.42505 | 0.00000 | 0.00000 | ||
| 2 | 2009.08.04 00:00 | close | 1 | 1.00 | 1.44196 | 0.00000 | 0.00000 | -1691.90 | 8308.10 |
| 3 | 2009.08.04 00:00 | buy | 2 | 1.00 | 1.44196 | 0.00000 | 0.00000 | ||
| 4 | 2009.08.11 00:00 | close | 2 | 1.00 | 1.41450 | 0.00000 | 0.00000 | -2749.50 | 5558.60 |
| 5 | 2009.08.11 00:00 | sell | 3 | 1.00 | 1.41450 | 0.00000 | 0.00000 | ||
| 6 | 2009.08.21 00:00 | close | 3 | 1.00 | 1.42456 | 0.00000 | 0.00000 | -1016.80 | 4541.80 |
| 7 | 2009.08.21 00:00 | buy | 4 | 1.00 | 1.42456 | 0.00000 | 0.00000 | ||
| 8 | 2009.08.31 00:00 | close | 4 | 1.00 | 1.43053 | 0.00000 | 0.00000 | 593.00 | 5134.80 |
| 9 | 2009.08.31 00:00 | sell | 5 | 1.00 | 1.43053 | 0.00000 | 0.00000 | ||
| 10 | 2009.09.09 00:00 | close | 5 | 1.00 | 1.44945 | 0.00000 | 0.00000 | -1900.10 | 3234.70 |
| 11 | 2009.09.09 00:00 | buy | 6 | 1.00 | 1.44945 | 0.00000 | 0.00000 | ||
| 12 | 2009.09.21 00:00 | close | 6 | 1.00 | 1.46926 | 0.00000 | 0.00000 | 1975.00 | 5209.70 |
| 13 | 2009.09.21 00:00 | sell | 7 | 1.00 | 1.46926 | 0.00000 | 0.00000 | ||
| 14 | 2009.09.30 23:59 | close at stop | 7 | 1.00 | 1.46375 | 0.00000 | 0.00000 | 542.90 | 5752.60 |